


Primary: GOLD
Secondary: US30, NASDAQ
TIMEFRAME:M15
EXPLANATION AND STRATEGY
1. WHEN TO TRADING IS VERY IMPORTANT!
BLUE = EUROPE SESSION
YELLO
W=US SESSION
PURPLE=INTERSECTION EUROPE AND US
STRATEGY:
TRADE DURING US SESSION (8AM-4PM NY TIME)
PURPLE+YELLOW
2.
SELL: WAIT UNTIL PURPLE ARROW AND YELLOW DOT CONFIRMATION
BUY: WAIT UNTIL BLUE ARROW AND BLUE DOT CONFIRMATION


Hi everyone,
Is there an indicator that can show pip count per candle if specified? So if I only wanted to see values of candles with over , say, 15 pips? Is there such an indicator?

GOLD H1


The basic theories of fundamental and technical aspects are revealed here. In addition, there are 6 secret keys to trading success that you will acquire in this book.
The first plain-English introduction to foreign currency exchange trading--one of today's hottest profit opportunities
The foreign currency market is the largest financial market in the world, and foreign exchange trading is quickly becoming one of today's most high-profile, potentially lucrative markets. One problem is that books on the topic are complex, technically dense, and difficult for Forex novices to grasp.
FOREX Made Easy is the first book to approach the topic in a detailed yet accessible style, gradually and deliberately moving from simple to complex in easy and natural language. Author James Dicks--founder of the popular trading software 4X Made Easy--draws upon his trading knowledge to give readers only the information they need, from setting up a workstation to trading electronically.
This Forex guidebook provides traders with:
Author(s): James Dicks
Pages: 239 pp
File size: 5.3 mb
Language: English

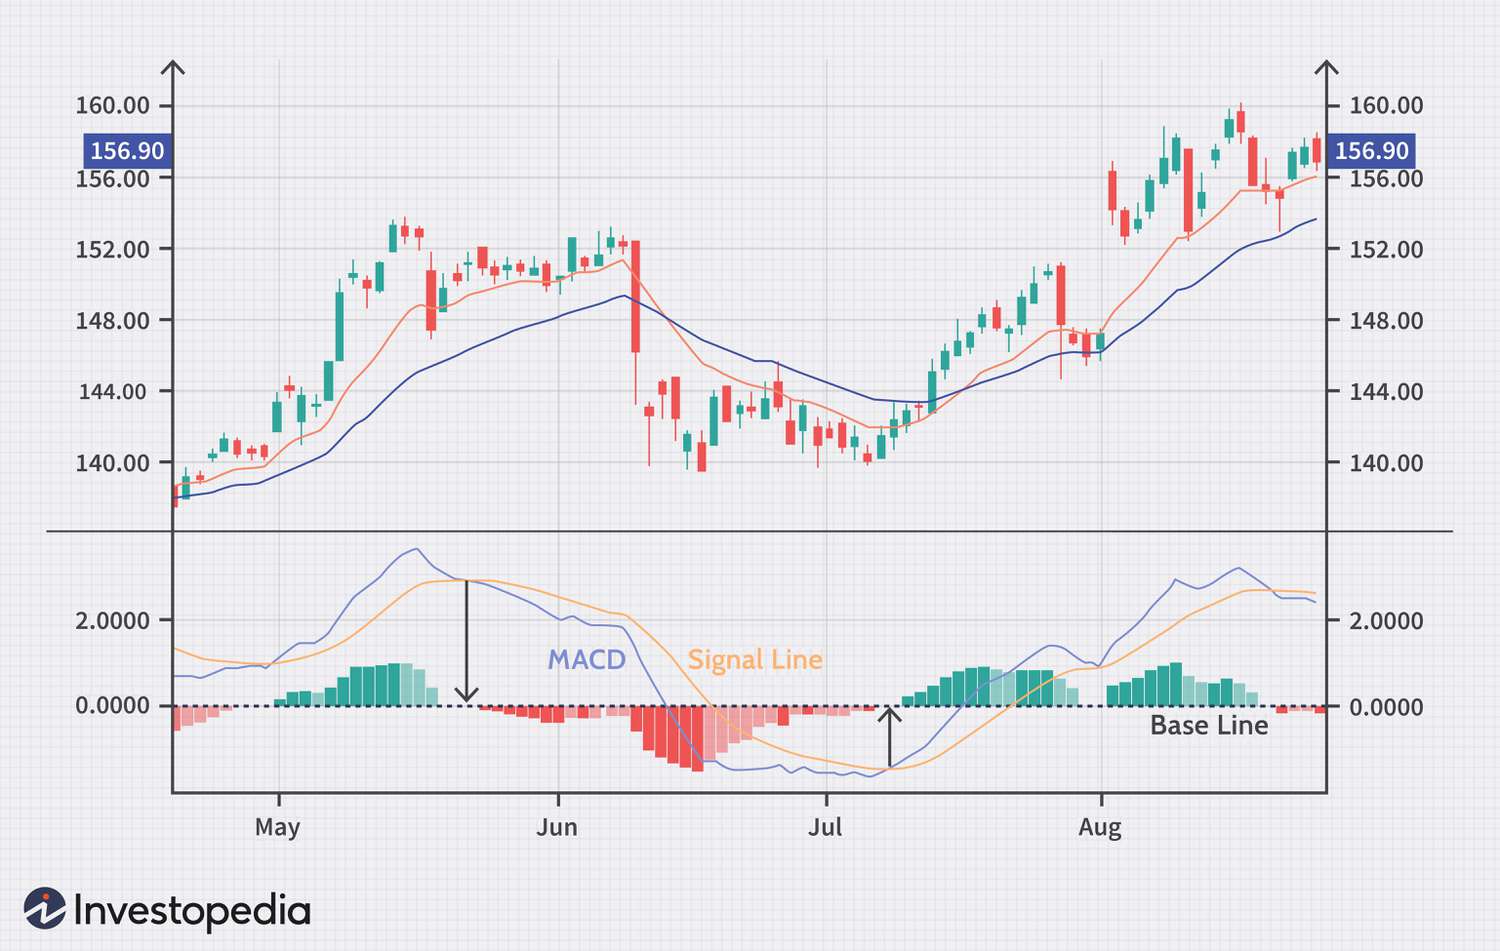
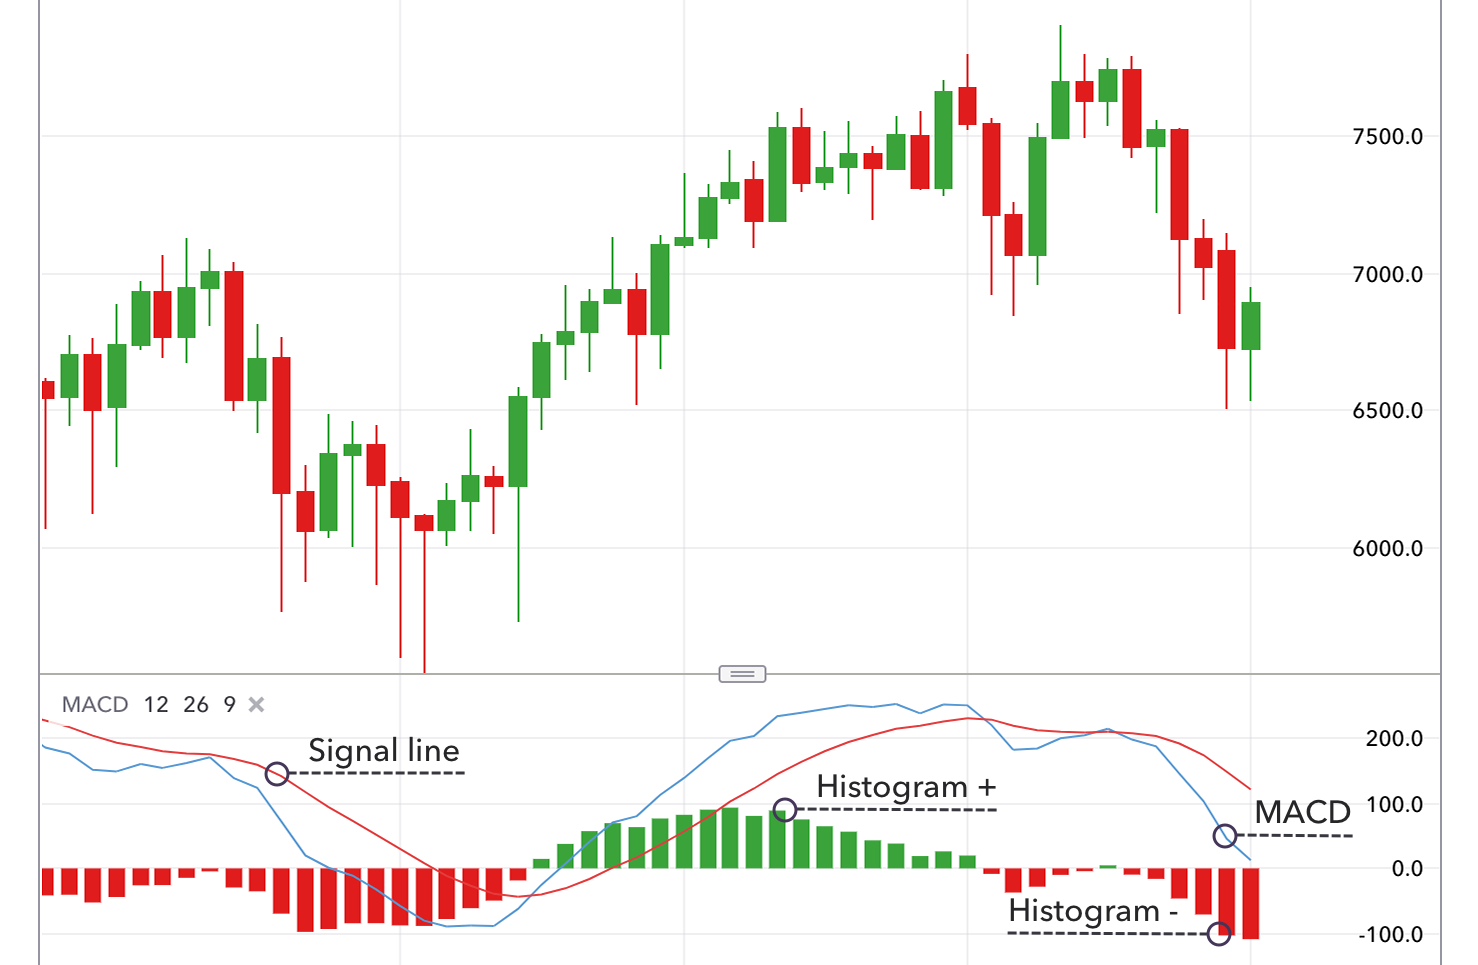
Everything You Need to Know About Using MACD (Moving Average Convergence Divergence)

MACD (usually pronounced Mac-Dee) stands for Moving Average Convergence Divergence.
.jpg)


.png)


The super tool to catch trends in Forex and other markets. Compatible with all timeframes. This indicator supports alerts, so you don’t miss a single signal. Free to download, easy to install. Try now!
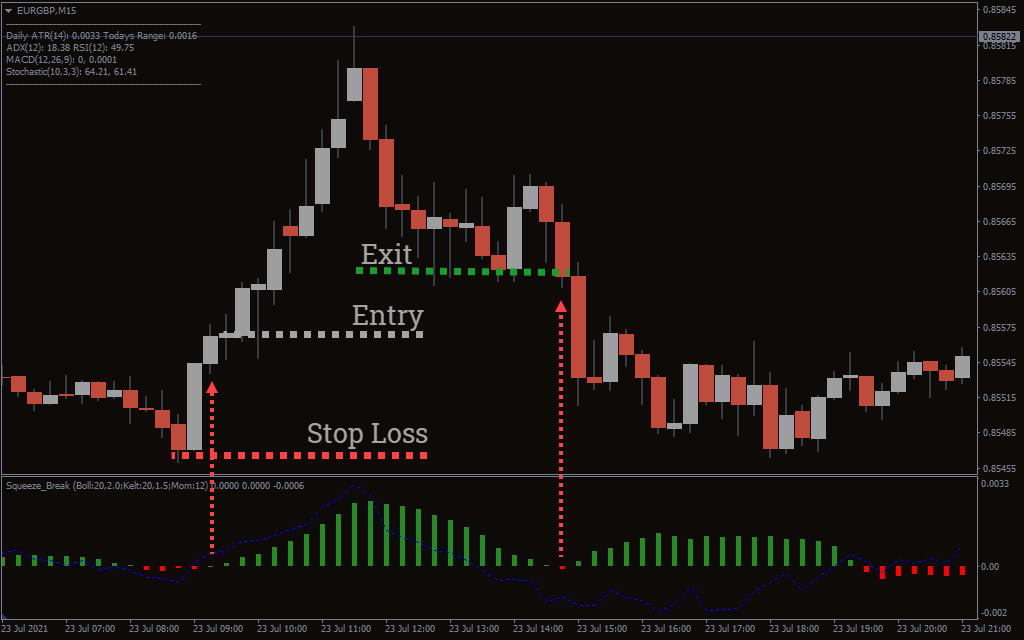
This indicator is designed for trading the strategy first mentioned in the book “Mastering the Trade” written by John Carter. The strategy is based on the changing volatility of any market. In both the Forex and stock markets, stages of trends alternate with stages of flatness. And in order to make money, you need to buy at the beginning of a bullish trend, sell at the beginning of a bearish trend, and hold your position until the trend persists. The Squeeze Break indicator for Metatrader 4 will help you do this. It is displayed in a window below the price chart and consists of a red-green histogram and a blue oscillator line.

The histogram shows the presence of a trend.
If there is a trend in the market, the histogram is green, if there is no trend, the histogram is red. The larger the bars in the histogram, the stronger the trend.
The blue line shows the direction of the trend. If the blue line is below zero, the trend is bearish. If the blue line is above zero, the trend is bullish.


.png)


support and resistance trading strategy
support and resistance
support and resistance indicator
support and resistance explained
support and resistance trading
support and resistance indicator tradingview
support and resistance for beginners
support and resistance trading strategy tagalog
support and resistance forex
support and resistance strategy
support and resistance trading indicators
support and resistance tagalog
support and resistance scalping strategy
support and resistance lux algo
support and resistance
support and resistance indicator
support and resistance forex
support and resistance strategy
support and resistance indicator mt4
support and resistance level
support and resistance in crypto
support and resistance indicator mt5
support and resistance role reversal
support and resistance trading strategy


Super Signal Price Action Strategy
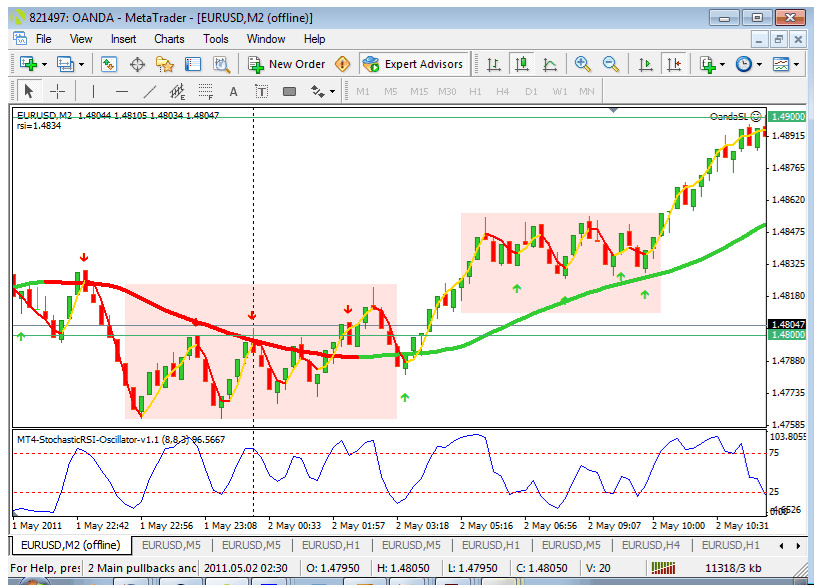
Binary Point Reversal is a trading system suitable for binary options and forex trading it's based on polynomial reversal as filter. The trades only in the external band of channel, for confirmations I added the stochastic oscillator and a fast slope direction line with reversal dot. this strategy works in 1 min time frame for trading with binary options, but you can do it in five minutes. All time frames are valid for forex. Being a price action strategy requires practice. This strategy works well in the side markets and can also predict trends. My advice is to use it on neutral markets, so the first task is to look for side markets at 5 min or 15 min if used at 1 min for high / low binary options. Also for the forex it is worth the same speech to look for side merchandise at time frames following the one you want to use.
Time Frame 1 min or higher.
Currency pairs majors and minors, Indices and commodities.
Expiry tuime 1 min time frame 5 candles. 5 min 3 candles.
Metatrader 4 indicators
Candle Time indicator mq4.
Slope direction mq4 (5 period) very fast.
Super signal.
Trend (polynomial regression channel) period 200.
Reversal dot ( 3 zz semafor indicator mq4).
Stochastic SMA (5,3,3) close.
Trading Rules Binary Point Reversal
Call or buy
Super signal and revesal dot they form in the lower bands of the channel.
Slope white line.
Recommended stochastic crosses upwards when it is lower than 20 level.
Put or Sell
Super signal and revesal dot they form in the upper bands of the channel.
Slope red line.
Recommended stochastic crosses downwards when it is upper than 80 level.
In the pictures Binary Point Reversal in action.


Forex and Binary Point Reversal
Free Download Files
Message us here: https://www.facebook.com/214kea


.png)
.png)
.png)
.png)
.png)


.png)
.png)

.jpg)
.jpg)

